SimuXL is an Excel add-in for cost, schedule and engineering risk. Some of the numbers you typed are not really single numbers — write them as what they are, run your model thousands of times, and read the range of answers it produces.
Already licensed? Extend your updates →
Latest release: loading…
SimuXL never looks inside your formulas, so anything Excel can compute, it can put a range around. Your SUMs, lookups and escalation factors stay exactly as they are.
A cell that held 10 becomes =SXL.Triangular(8, 10, 14). Type it — Excel offers the list as soon as you type =SXL. — or use the Input dialog. When nothing is running the cell shows its average, so the model still reads as it always did.
Select the cells whose answer you care about — a total, a finish date, a clearance — and press Output once. A risk register is one formula per row: =SXL.YesNo(0.05) * SXL.Triangular(10, 20, 50).
Press Run Simulation, then look at the distribution of each output and at which inputs drove it. Every run is reproducible under a seed you choose, and every number it reports can be traced back to the sample that produced it.
An auditable probabilistic tool for engineers, estimators and cost and schedule risk analysts — built to be checked, not just believed.
Triangular, Beta-PERT, Uniform, Discrete Uniform, Normal, Lognormal, Custom Discrete and Yes-No. Every one is an ordinary formula with in-cell IntelliSense; parameters can themselves be formulas or cell references.
Same model, same seed, same numbers — on any machine. The run record carries the seed, the trial count and the sampling method, so a reviewer can reproduce your run rather than take your word for it.
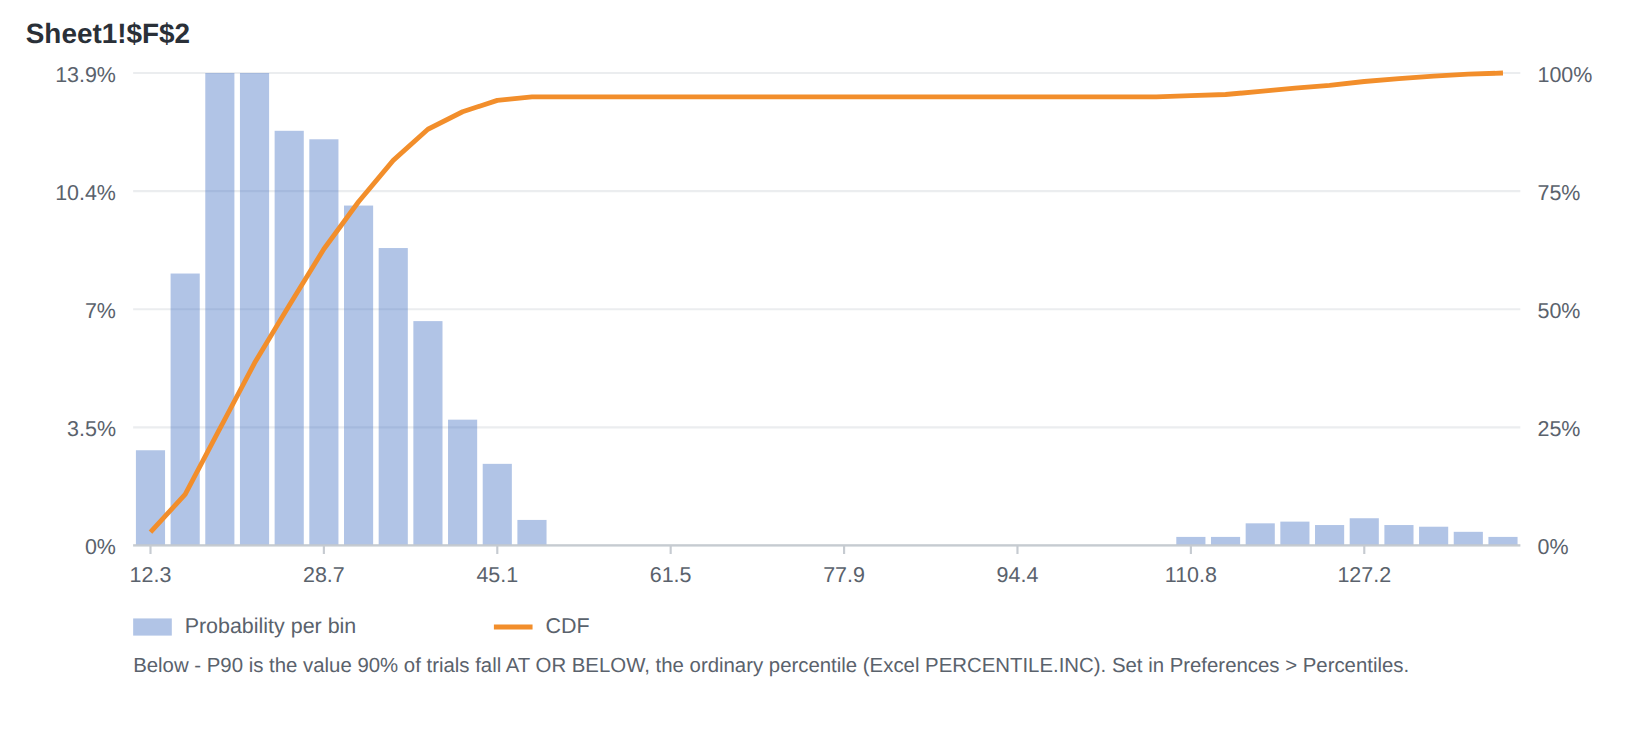
The distribution of each output with its cumulative curve, percentile markers and the contingency above any marker you choose — on a sheet, or in a window that writes nothing to your workbook.
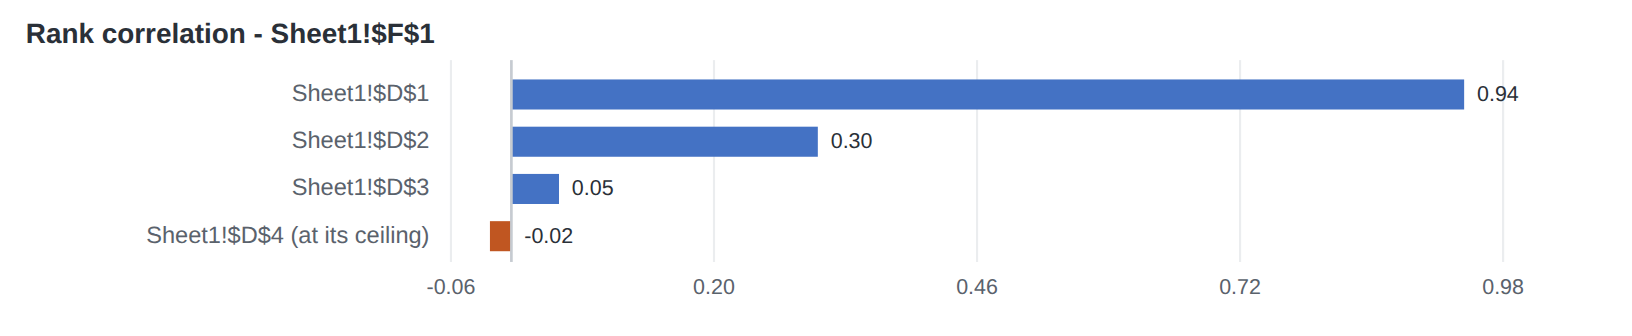
Which inputs drive each output, ranked by signed rank correlation — and an honest note when an input sits at the ceiling its own shape imposes, so a rare risk is never mistaken for an unimportant one.
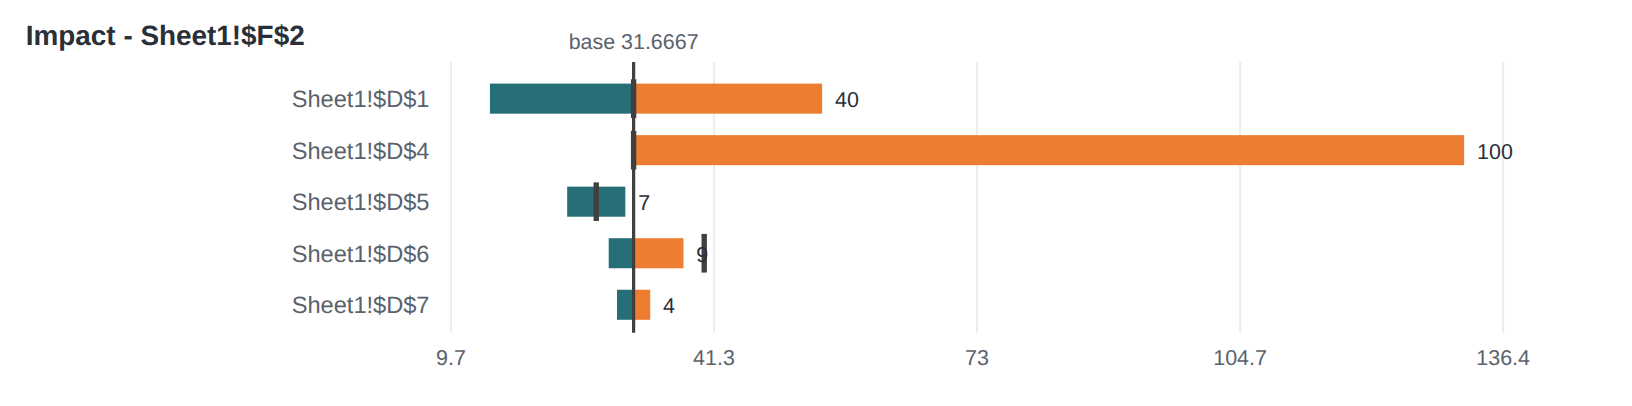
How far each input can move each output, measured in the output's own units by swinging it across its range while everything else holds its base value.
What actually ran atypically in the trials at each end of the range — the inputs that were unusual when the answer was, ranked by standardized shift. The question a tornado cannot answer.
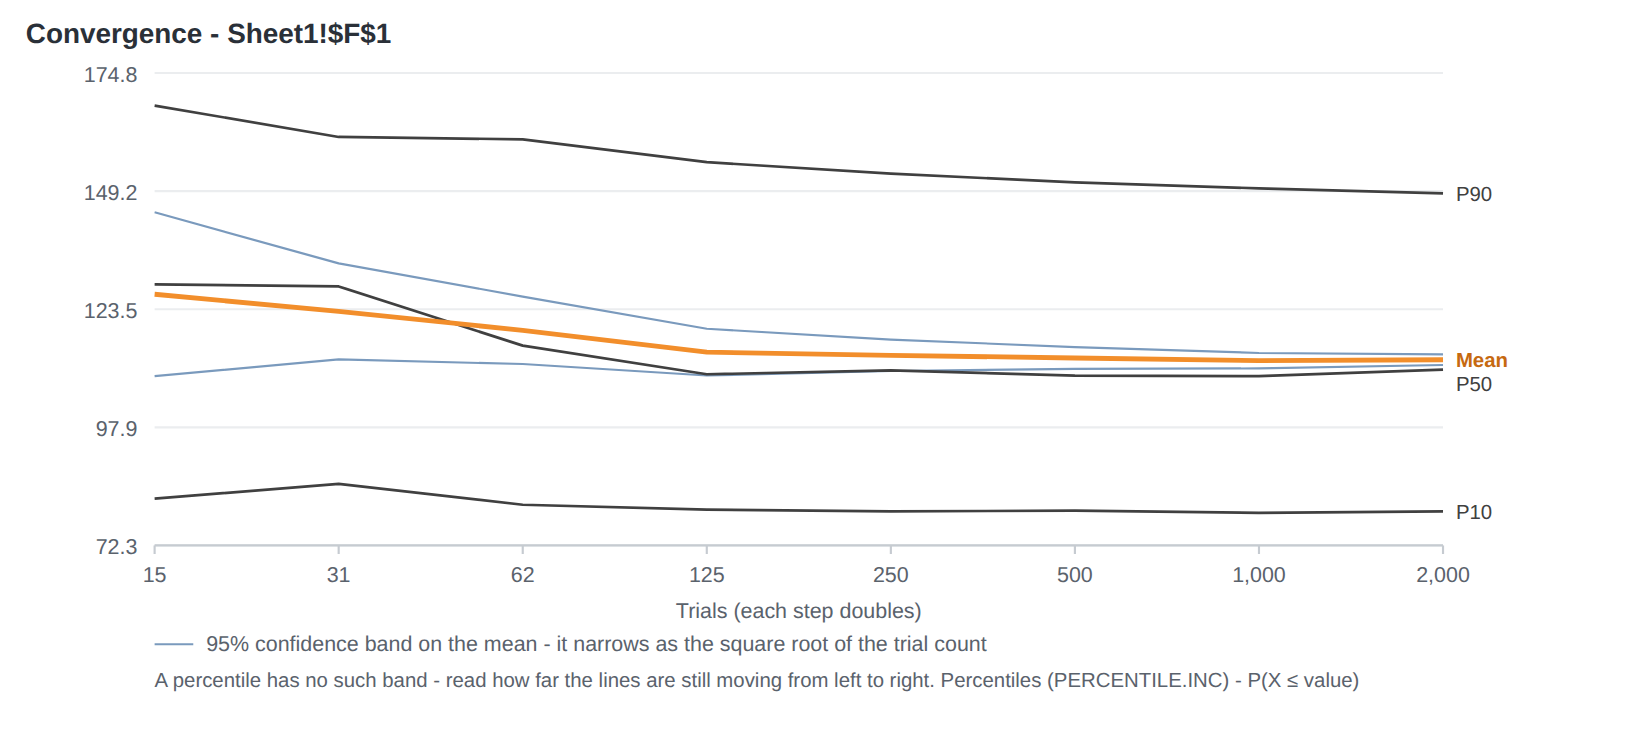
Was this run long enough? The mean and the percentiles you quote, plotted as the trials accumulate, so you can see them settle — or see that they have not.
Declare rank correlations between inputs, one-to-one or one-to-many; SimuXL induces them through a copula and reports what was achieved against what was asked.
Spread the draws evenly across each distribution for tighter percentiles from fewer trials. The guide says what it buys, what it costs, and why a seed alone no longer identifies a run.
What each input actually drew against what it should have, and a listing of everything SimuXL found in the workbook — including what it could not account for, rather than guessing.
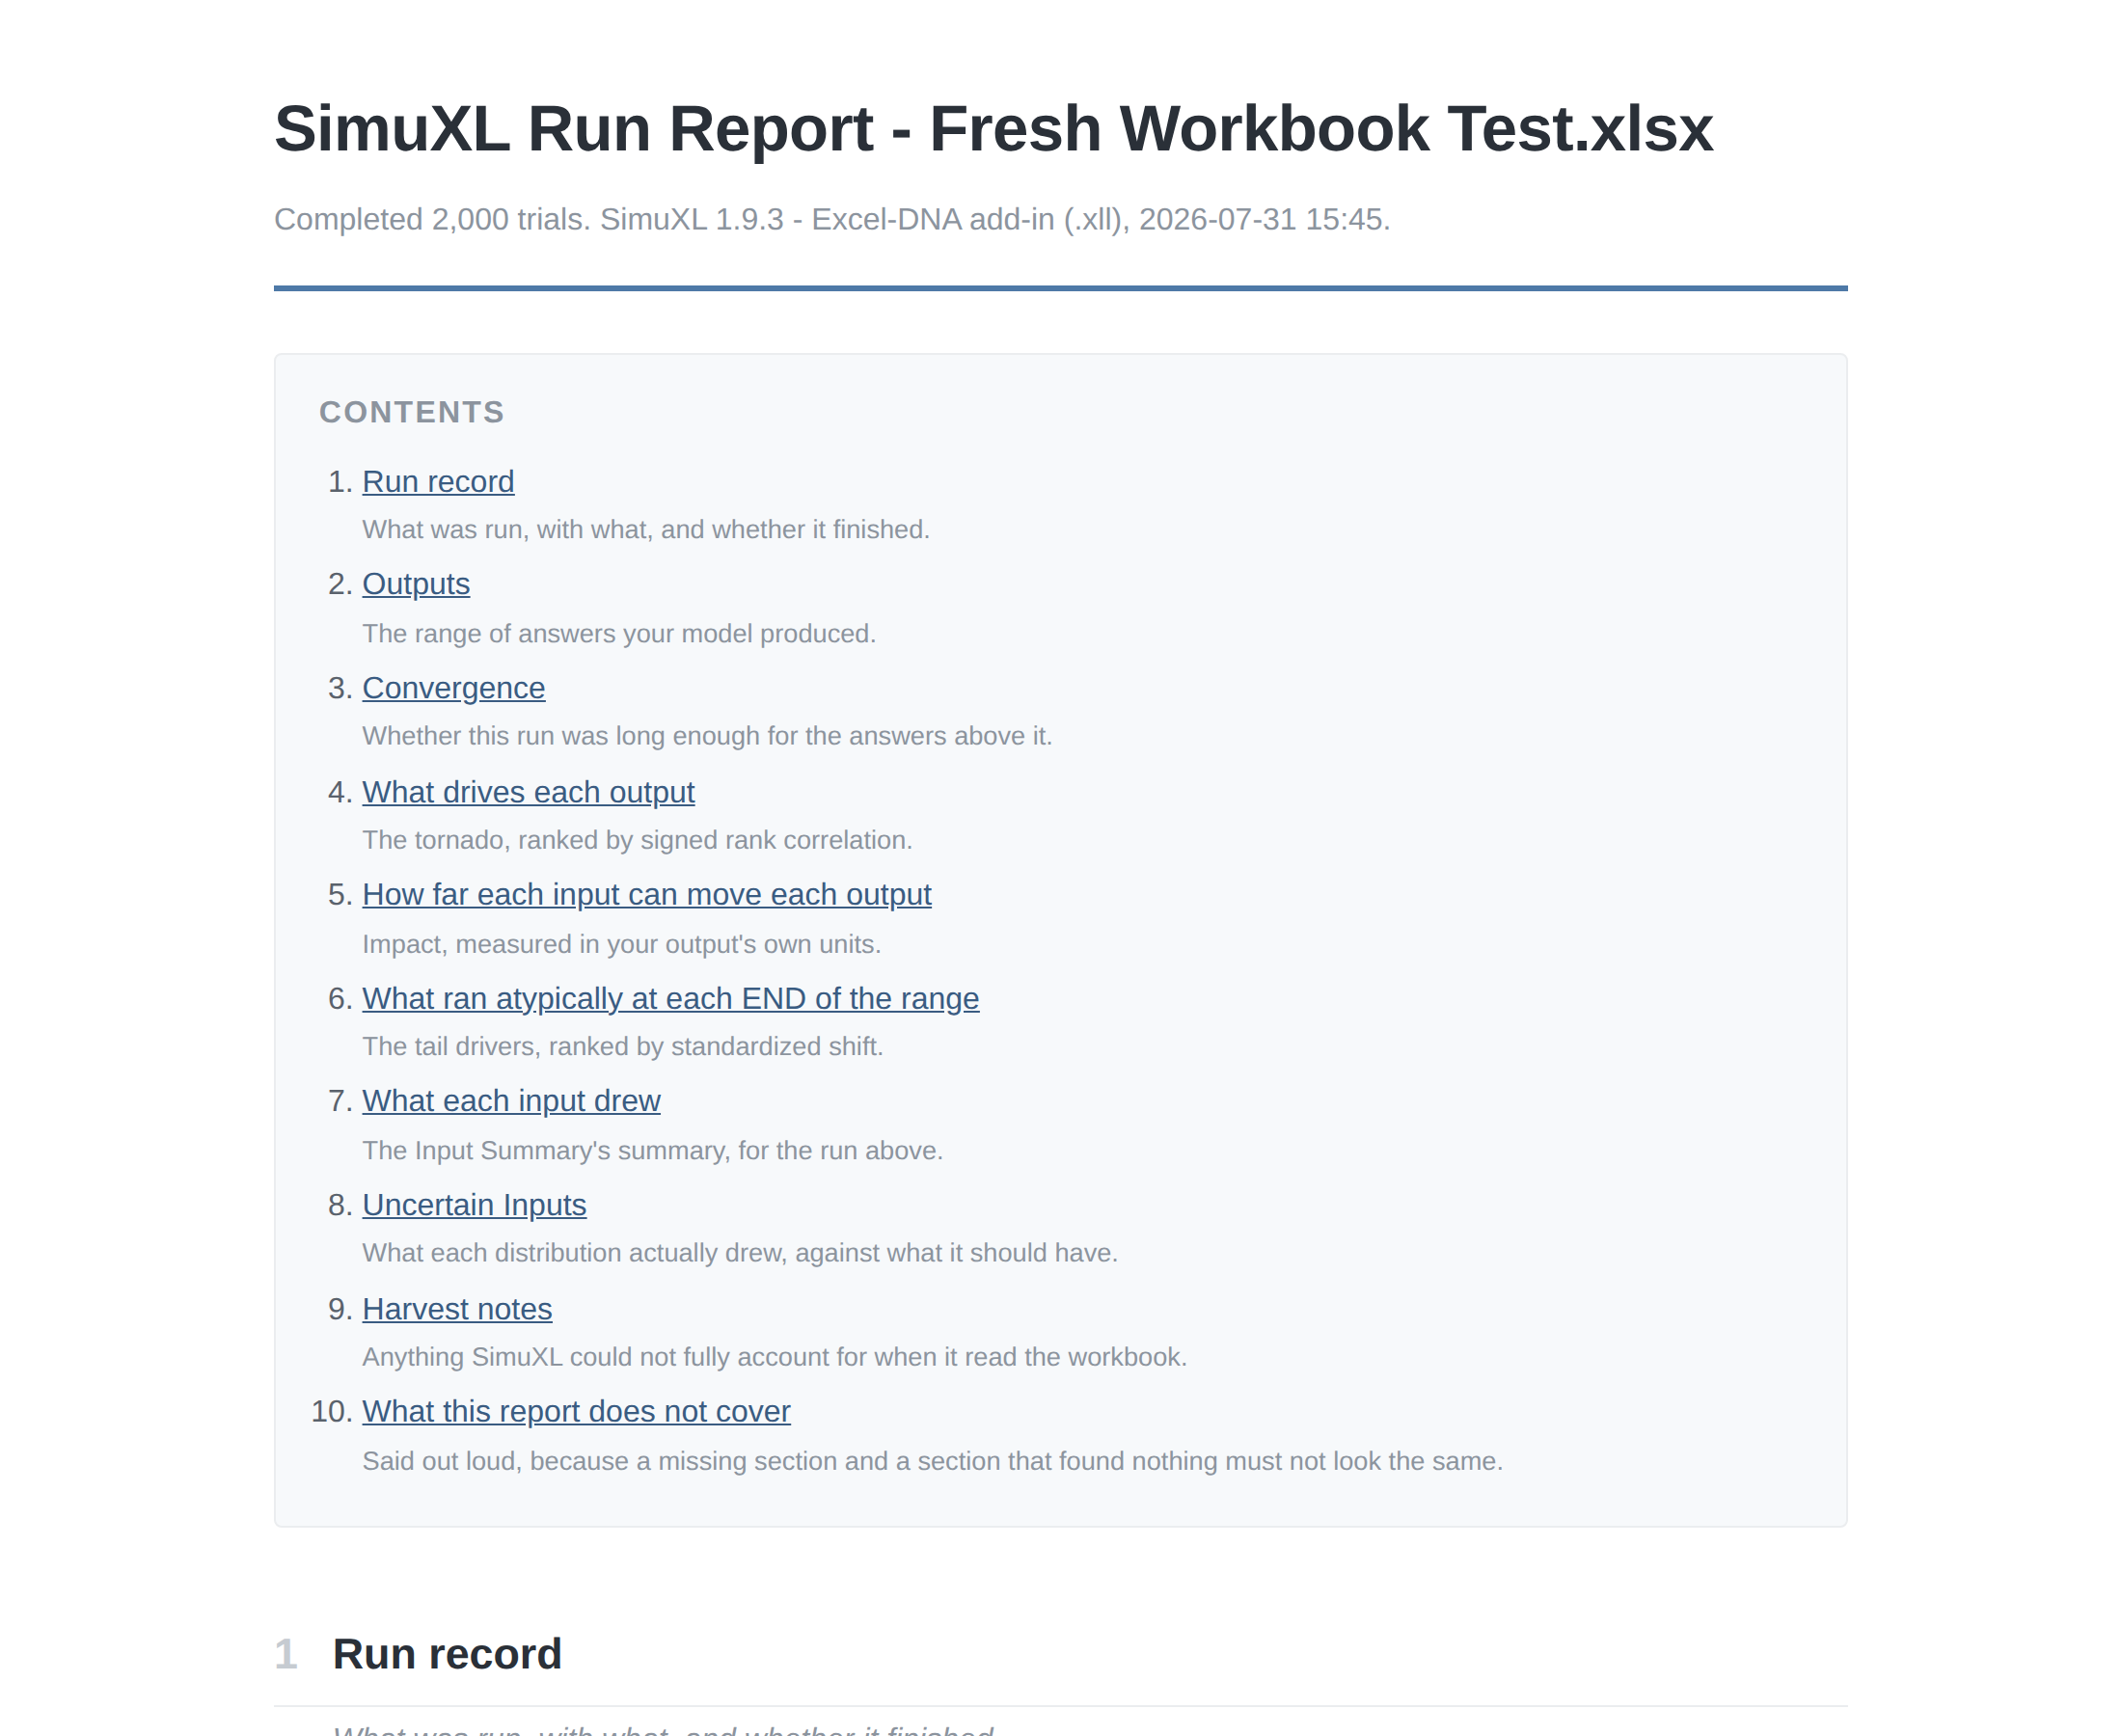
The whole run as one shareable file: run record, outputs, convergence, drivers, impact, tail drivers and every input — and a section saying what the report does not cover.
Cells that hold a decision rather than a chance. Type alternatives into a table, run the whole table, and compare the distributions each decision produces.
Name an input in its own formula, hold one at its base value for a run without editing the model, and correlate it with others — the three things you can attach to an Uncertain Input.
Every trial's draw for every input and output, so you can check any figure in any report with your own arithmetic.
Every release is code-signed by the publisher. SimuXL needs no internet connection and sends nothing about you, your machine or your workbook anywhere.
The things that stop a run are named before the run, with the reason and what to do instead — a cell that draws more than its formula shows, an argument left empty, a call that never fired.
Every one is an ordinary worksheet function. Start typing =SXL. and Excel offers the list, or use the Input dialog. Each takes an optional Name as its last argument.
| Function | Arguments | Use it when |
|---|---|---|
SXL.Triangular | Minimum, MostLikely, Maximum | You can state a low, a high and a most likely. The workhorse of cost and schedule estimating. |
SXL.BetaPert | Minimum, MostLikely, Maximum, Lambda (optional) | Same three numbers as Triangular, weighted towards the most likely value. The convention in use is stated in the guide. |
SXL.Uniform | Minimum, Maximum | Anything in the range is equally likely and you have no reason to prefer the middle. |
SXL.DiscreteUniform | Minimum, Maximum | A whole number from Minimum to Maximum, each equally likely — a die, a count of units, a month. |
SXL.Normal | Mean, StdDev | A quantity that scatters symmetrically about a centre. It has no lower bound. |
SXL.Lognormal | Mean, StdDev | A quantity that cannot go below zero and has a long upper tail. Arguments are of the values themselves. |
SXL.Discrete | Values, Probabilities | A handful of specific outcomes with specific chances, as ranges or inline: =SXL.Discrete({10;20;30}, {0.25;0.5;0.25}) |
SXL.YesNo | ProbabilityOfYes | Something either happens or it does not. Returns 1 or 0, so multiply it by an impact. |
A risk model is already in your spreadsheet. SimuXL is written to leave it that way.
No SimuXL command writes a value into a cell you did not ask it to. Inputs are formulas you typed; outputs are cells you selected. Freezing an input for a run does not edit it.
An analysis is written to a sheet of SimuXL's own — by default a new sheet in your workbook, replaced on the next run — and none of your cells is edited. If you would rather each analysis arrived in a workbook of its own, that is one setting away.
Runs, analyses and reports happen entirely on your machine. The optional update check reads one small signed file and sends SimuXL's version number and nothing else — no machine id, no licensee, no workbook name.
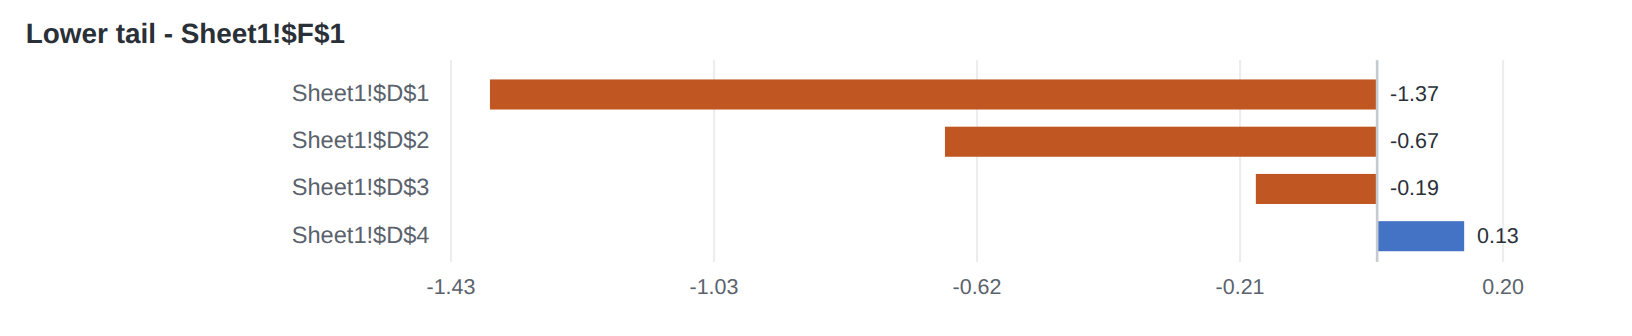
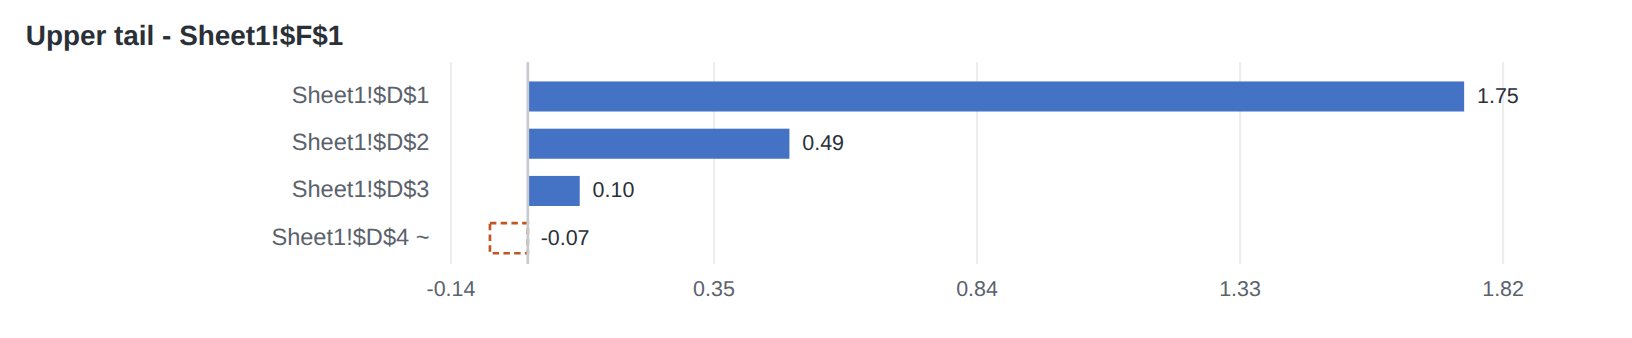
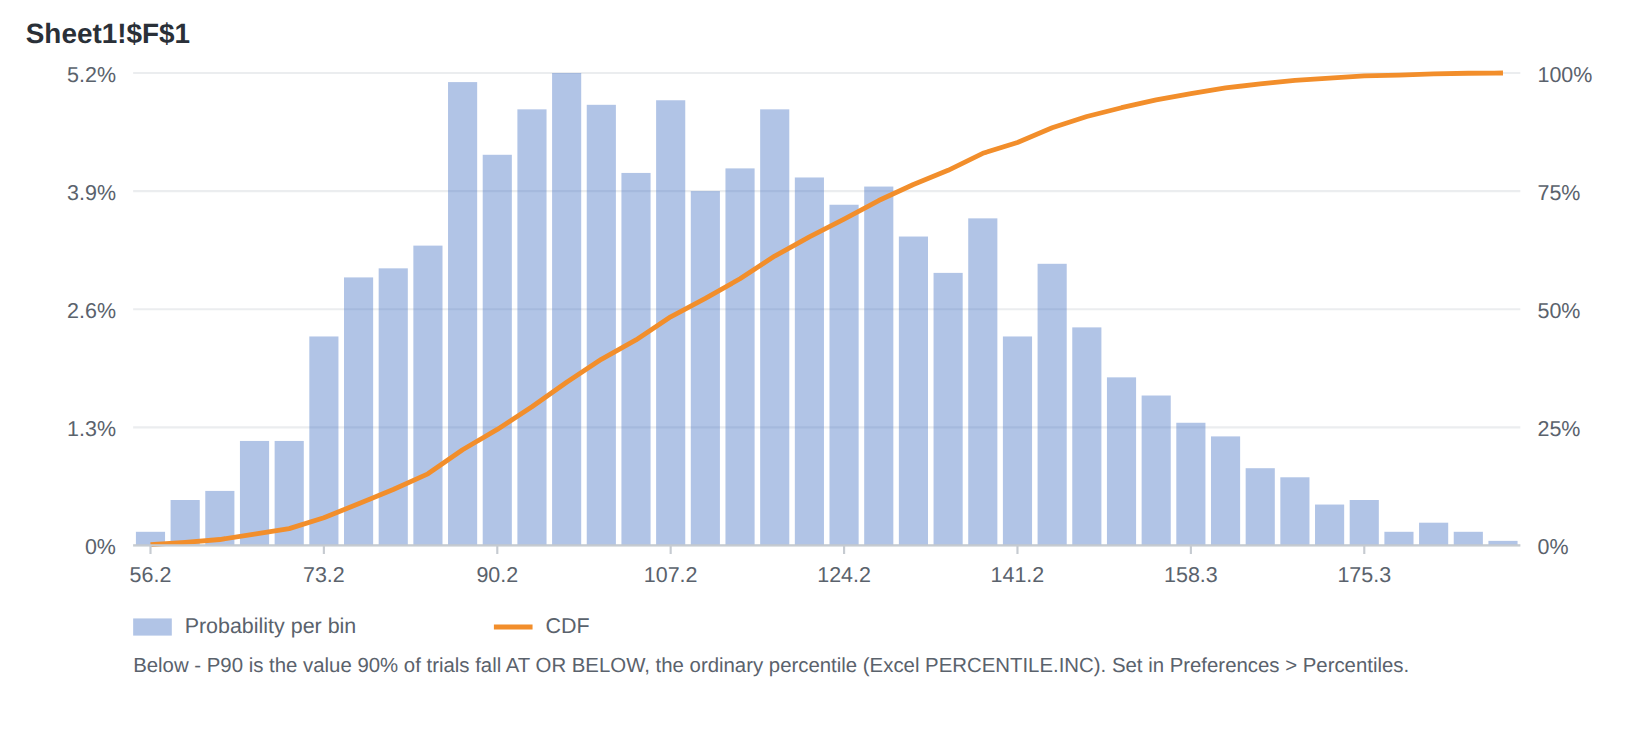
Charts from a SimuXL HTML Report of a 2,000-trial run. Every one of them also lands on a worksheet, and the raw trials behind them can be exported.
Signed rank correlation, ranked. The input shown in orange sits at its ceiling — a Yes-No with a small probability cannot correlate more strongly than its own shape allows, and SimuXL says so rather than ranking it last in silence.
Each input swung across its range with the rest of the model at base, measured in the output's own units.
The mean and the quoted percentiles as the trials accumulate. If the lines are still moving at the right-hand edge, run more trials before quoting the number.
Probability per bin and the cumulative curve. Whether P90 means the value 90% of trials fall at or below, or above, is a preference — and the chart states which is in force.
Which inputs ran atypically in the trials that produced the lowest answers, ranked by standardized shift.
The same question at the other end of the range. A tornado ranks inputs over every trial; the tails answer what happened when the answer was extreme.
Ten sections, from the run record to a closing section saying what the report does not cover — because a missing section and a section that found nothing must not look the same.
Screenshots of the ribbon and dialogs inside Excel are being added. The User Guide describes every dialog.
Start with a free 30-day trial — the full add-in, nothing to enter. Then choose a perpetual license that includes 12 months of updates, or a subscription that always runs the newest release. One license covers one machine.
Runs forever on every SimuXL release dated within your 12-month service period. After that your installed version keeps working; newer releases need an extension.
Delivered as an activation code you paste into Help › License.
Already own SimuXL? Move your license's Supported-Through Date another 12 months on, so the releases published in that window are yours to install.
Help › About shows the date your license currently runs through.
Every release, for as long as the subscription runs. When it ends, SimuXL keeps running for 14 days and says so at each run, then stops simulations until it is renewed.
Delivered as an activation code, the same way.
Payments are processed by Stripe. Prices are in US dollars. See the License Agreement for the full terms, including the 30-day refund policy.
A license to run SimuXL on one machine. A perpetual license never expires and runs every release dated on or before its Supported-Through Date — 12 months after purchase. A subscription runs every release until its paid-through date.
Your installed SimuXL keeps working, forever. If a newer release is published and you want it, extend the service period for TBD. If you do not care about new releases, do nothing.
By email, within 24 hours of payment, as a short activation code beginning SXLA-. Paste it into Help › License and press Activate; SimuXL fetches its key once and never needs the internet again for it.
No. Runs, analyses and reports never leave your machine. Activating a code makes one request. The optional weekly update check sends the version number and nothing else, and you can turn it off.
A key is bound to one machine. You may rehost once per rolling 24 months at no charge — email support with the new machine's id from Help › License and a key is issued for it.
Yes. If SimuXL is not working for you, contact us within 30 days of purchase for a full refund.
Desktop Excel on Windows, 32- or 64-bit; the installer reads which you have and installs the matching add-in, with no administrator rights. It is not for Excel on the web or on a Mac.
Nothing. The 30-day trial is the whole add-in, on each machine, with nothing to enter. Trial output is for evaluation rather than for commercial deliverables — see the license agreement.
SimuXL is built for people whose numbers get audited. Everything below is a property you can check yourself rather than a claim to accept.
A run is identified by its seed, its trial count and its sampling method, all of which the run record carries. Rerun it and you get the same trials; export them and you can recompute any statistic the reports print with your own formulas.
The User Guide gives the convention behind every distribution — which Beta-PERT, which percentile definition, what a cell shows at rest and why — and each analysis explains what it measures and what it cannot. Every chart states its convention on its face.
Every release passes an automated gate before it is published: the numerics are cross-checked against independent implementations, the eight inverse distributions are checked for monotonicity, every dialog is measured for clipping, and every report is rendered and read.
Find Inputs lists what SimuXL found and what it could not account for. A rule that stops a run names the cell and the reason. The report ends with the section that says what it does not cover.
The installer and both add-in files are code-signed by Michael Ray Smith, and each release page carries the installer's SHA-256 so you can check the download before running it. Windows verifies the signature; Help › About shows the result.
SimuXL runs entirely on your machine. It reads nothing from the internet unless you press Check for Updates or leave the weekly check on, and even then it sends only its version number.
SimuXL was created by Michael Smith following his retirement from the Federal Highway Administration in 2023, where he spent 32 years advancing quantitative risk assessment for highway infrastructure projects. It is the companion to CASTR, his standalone cost and schedule risk application: where CASTR gives you a complete risk-register workflow, SimuXL brings the same probabilistic thinking to a model you have already built in Excel.
The add-in is written for engineers, estimators and analysts who need an auditable result: reproducible runs, stated conventions, and reports that say what they do not cover. It is distributed as a signed installer, and runs entirely on your own computer.
Compatible with desktop Excel on Windows, 32-bit and 64-bit.
When reporting a problem, include the line Help › About prints under Build and, if a run is involved, the seed and the trial count.